Thursday, 1 December 2016

Data localization in the EU: The threat from inside

As growth in the EU has remained low and the usual channels for recovery such as greater investment or an increase in the working-age population remains far-fetched, the omen is on creating higher productivity to restore economic recovery. Here, the EU finds itself in a difficult situation as it has been caught in a productivity slump now for many years.

Therefore, any measure that would further hurt EU’s productivity would be a reasons for great concern.

One example is the measure of data localization that is now threatened to be on the table again. Data localization concerns stem from the fact that citizens feel that their data is not sufficiently protected when sent and stored abroad. That concern is legitimate and policy makers should be aware of that.

Yet data localization is not the right answer. Although policy makers should strike the right balance between societal needs and economic benefits, data localization has proven to hurt the EU's economy more than it would protect European citizens. A few factors may explain this.

First, data localization and its associated regulations excessively hurts producers and users of data as they significantly hurt EU productivity, which is a measure of the way in which we effectively use our economic resources. Our research has shown that implementing regulations related to data will ultimately render prices higher of consumers and lower economic output.

Second, data localization as such does not provide more security per se. On the contrary, data localization brings together the many data of producers and consumer making it more interesting target for cyber security attacks. Instead, spreading data would be a better option so as to make it more difficult for hackers to target a so-called “honey pot” of data.

Third, spreading the storage of data also let the best suited servers to do the job of providing safe and secured data. Obliging each member state to store its own consumers’ data on its own servers is no recipe for best practise. Some member states are just better equipped to provide good storage of data than others because they are better endowed with the economic necessities of doing so.

Fourth, upfront short-term economic losses would have to incurred by everyone. Our study shows that assuming the existing explicit barriers on internal EU free flow of data are removed, it would result in GDP gains that are estimated to be up to 0.06% of GDP, equivalent to 8 billion euros.

In short, the EU has created a single market in great part to enhance economic wellbeing of its citizens. That has been done through abolishing burdensome regulations that otherwise would inhibit productivity, ultimately hitting on economic growth.

The EU’s future economic growth lies in the digital age in which data flowing across European borders is a crucial factor, just as services, goods, capital and people. Establishing a truly single European market now also demands one for data. 

Thursday, 24 November 2016

A US retreat from TPP: What does services trade tell us?

During last weekend’s summit meeting of Asia-Pacific leaders in Peru, President Obama made the case that failure to sign on to TPP would “undermine our position across the region”. It would mean that if the US would not sign on the trade agreement, China would assert more leadership in the Asia-Pacific and opening a way to negotiate trade rules.

Trade patterns between countries underpin the economic diplomacy behind any potential trade agreement. That too for the TPP. If we focus on one area in which most TPP members have an interest for future trade, namely services, that concern of changing trade leadership may be true.

The picture below shows the so-called Trade Complementarity Index (TCI) for both the US and China with regards to all TPP members (excluding US). This index provides us with an idea how much the exports and imports of the US and China separately match with other TPP members’ needs, or are complementary. A high index means a good “fit” in terms of trade relations and indicates a great potential for a trade agreement between members. 

Note that this picture tells us the trade complementarity of cross-border trade in services or what others have called “digital deliverable services”, which are services that are traded over the Internet. Incidentally, TPP has the standard when it comes to the cross-border flow of data, a factor that reinforces trade in digital services.


The pattern that arises is that initially the gap between the US’s and China’s trade match with other TPP partners in services trade narrowed. However, since 2008 it has widened pointing out that the US has found better trade complementarity with other TPP members. Around that time the US entered the trade talks.

Whether the widening gap is really due to US involvement remains to be seen, but what clearly stands out is that at some point China was as much a good fit for trading services with these TPP partners as the US was.

Yet, already before the US jumped in the negotiation talks, China’s services trade complementarity diminished in the region. This downward trend seems to be of a longer nature, which may be due to China’s regulations in the digital economy over these years. If that’s the case, it puts a serious question whether China can lead the region in terms of services trade, an item the Chinese government is eager to capitalize on.

On the one hand, therefore, in a scenario that the US won’t ratify the trade pact, nothing tells us that this pattern could return. This would reinforce China’s role in the region regarding services trade that can be traded over the internet and indeed may therefore assert its influence to set the rules in this area.

On the other hand, Chinese decline of the trade pattern in digital delivered services is no good recipe to underpin China’s potential future role in the region. If China was serious about fortifying these trade relations, it should start thinking about some of its digital regulatory policies that enable digital services trade. 

Thursday, 17 November 2016

How should the EU Article 29 Working Party look like?

As traditional trade measures at the border such as tariffs have come down and as more items in the economy have become tradable, policy reform has focused on dismantling trade barriers that are “behind-the-border”. 

These measures span a wider variety of goods and services on which traditionally only domestic regulators had a quasi-monopoly on to develop and advice policy. Over time, as these behind-the-border measures inhibit trade, regulators need to strike a balance with trade negotiators.

This is also true for “trade in data” or the cross-border flow of data. Data has become an item that crosses borders many times and which form an item in trade agreements these days such as in TPP. 

This is also true for the EU where the Privacy Shield has been developed, which is a framework that provides companies on both sides of the Atlantic a mechanism to comply with EU data protection requirement when transferring personal data from the EU to the US in support of transatlantic trade. 

Before the European Commission could adopt the shield, the Article 29 Working Party committee or the data protection authority, which is in fact not the regulator, but a platform that provides general expert advice on data protection matters and advised the Commission by giving an opinion on the proposal. This is a good thing as certain rights need to be protected in light of an item that becomes increasingly an economic one. 

It’s a classic example where policy makers need to strike a fine balance between an economic need (commerce) and a noneconomic goal (right of privacy). The point for this platform, which is composed of National Data Protection Authorities from each member state, the European Data Protection Supervisor and the European Commission, is to provide an opinion that would entail a removal of overly burdensome and restrictive regulations in attempt no efficiency is lost and yet secure the concern of data subject. 

However, the issue here is the configuration of the Working Party committee itself. Since the Working Party committee will ideally need to strike this balance between commerce and societal benefits, one would expect that their membership composition would be distributed accordingly. 

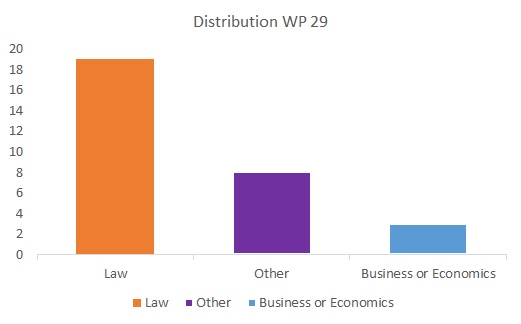
This is not the case however. Far from it as a matter of fact. The platform has in total 30 members (excluding one member from the European Commission). One from each member state plus a supervisor and an assistant supervisor. By checking each member’s background, the figure below presents the composition of the committee members by professional background. 


What strikes me is that a large majority of its members have a noneconomic background. The fact that most members are lawyers comes as no surprise and no reason for worry as the platform advises on European Community law. However, there are only two members with an economic background and a third one with a business background. Other educated professions that were included ranges from policeman to journalist. 

In age where the issue of data becomes an essential ingredient for economic activity, data subjects need protection. Yet, reaching the fine line between economic and noneconomic concerns starts in my view with a balanced composition of expertise and skills of those who provide expert advice upon policy. 

Tuesday, 25 October 2016

Wallonia's CAN trade continued

A couple of questions have been posed regarding the graph I developed for Wallonia’s trade share with Canada. Here are some of my explanations and further thoughts on the issue.

One remark that was made related to the fact that these figures would be biased because Flanders has Antwerp. Antwerp, like Rotterdam, are known for what trade-economists call their “entrepôt” activities. These two cities import lots of goods because of their ports, store them, and then re-export them again to other parts of Europe, i.e. the hinterland, which I indeed allude to in the piece.

This bias is true, but only to some extent. The NBB source that separates regional trade between Flanders and Wallonia on the one hand and Canada on the other presents data at a level where these imports and re-exports of non-residential entities are excluded, i.e. pure transit trade appears to be out. 

Friday, 21 October 2016

Wallonia's 0.45% EU-CAN trade

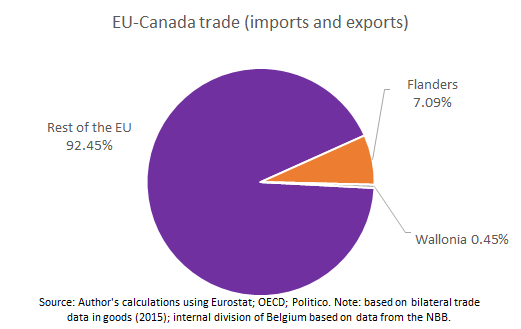
Since there is a crisis around CETA this week where the Wallonia region appears to be reluctant to sign the deal, I thought some economic numbers might be in place. It got me inspired by Politico who used rough community-level numbers for Belgium. Below you find my numbers:


The figure of Wallonia’s trade relations with Canada, compared to the rest of the EU, are astonishingly low with an overall figure of 0.45 percent. Note that I have been generous here with my back-of-the-envelope calculations.

In 2015, Wallonia seems to export more than it imports with Canada with a figure of almost 9.5 percent of total bilateral trade between Belgium and Canada. However, Wallonia barely imports anything from Canada, a low 1.37 percent of total bilateral trade between Belgium and Canada.

Now, a couple solutions to this puzzle might help explain Wallonia’s opposition. One, import-competing sectors are extremely powerful in this region. Second, Antwerp is in Flanders, not in Wallonia. Third, Wallonia’s current Minister-President has another agenda for which he likes to use CETA. 

Wednesday, 19 October 2016

Why concluding CETA is so important for the EU

Passions have been running high this week as the EU failed to get an agreement about signing off its trade deal with Canada, what is called CETA. As it stands now, some countries remain critical of the deal, or cannot sign the deal because of internal political differences. Whatever those reasons may be, they should think twice. Other countries have been catching up with the EU in the past decades and are already today more attractive places to trade with. 

Trade agreements are concluded with one simple goal: to lower the costs of trading between countries. In other words, the objective is to lower the costs of imports and exports of goods, with the view of staying competitive in the world. The most efficient way of doing this is through the multilateral system. If that doesn’t work, trade costs could be lowered between countries directly, i.e. through bilateral or regional trade agreements.

The CETA agreement is no exception. The figure below shows that trade costs between the EU and Canada have been decreasing over time starting from a common base, i.e. 100, as illustrated by the dark blue line except during the Global Financial Crisis. Note that trade costs include tariffs as well as non-tariff measure. This picture shows a rather good sign and therefore one may wonder why a trade agreement is necessary in the first place.


The answer to that is related to the orange line, which denotes the trend of trade costs between China and Canada. Trade costs between these two countries have been decreased more rapidly over time suggesting that it has become more advantageous for Canada to deal with China than with the EU. 

Read more about this in ECIPE's Bulletin that just came out!

Thursday, 13 October 2016

The Digital Trade Estimates (DTE)

Yesterday, me and my colleague Martina Ferracane at ECIPE launched the DTE database which describes all digital trade policies for 65 countries worldwide.

The DTE database is part of the wider DTE project that aims to provide transparency regarding digital trade policies in the world of international trade and trade policy. Besides the database, the project also covers an index summarizing all these cost-enhancing measures in the digital economy for all countries and issue areas. It also provides a website where you can find all this information and a final report.

The DTE database covers 13 chapters, each comprising a digital trade policy area, namely (1) Tariffs and trade defence, (2) Taxation and subsidies, (3) Public procurement, (4) Foreign investments, (5) IPRs, (6) Competition policy, (7) Business mobility, (8) Data policies, (9) Intermediate liability, (10) Content access, (11) Quantitative trade restrictions, (12) Standards, and finally (13) Online sales and transactions, i.e. e-commerce.

Although the full index and report will come out in November, people can already access the database as of now through the following website: http://ecipe.org/dte. Moreover, during yesterday’s presentation of the database, I showed a small snapshot of the index as shown below. Note that all other countries that are coved by the DTE project, including all EU member countries separately, will be disclosed during the launch of the report which will also explain our methodology.


The index ranges from 0 (most open) to 1 (least open). Unsurprisingly, one can see that China is the country with the highest score, meaning it is least open of all countries covered whilst the US and the EU have a far lower index score though still higher than the average score of the entire range of countries covered. Note that the EU score is a weighted average in the sense that this score corrects for the size of each member country’s market. If this weren’t taken into account, the index for the EU would be somewhat lower, i.e. a score of 0.22.

One surprising result, however, is the fact that that the US and the EU are actually on (almost) equal par with each other when taking into account all 13 chapters. The main reason for this outcome is that the US still has quite some cost-enhancing digital trade measures in place when it comes investment and competition policy, but also related to public procurement and even standards.

More on that in the database and the report that will come out soon!