Friday 31 January 2020

Market Structures in Services

Services have long been thought to suffer from a productivity problem. In fact, there is a long-standing concern that services add little to the economy. Particularly compared to manufacturing, which is typically more receptive to technological improvements, services productivity looks bleak.

What’s more, for various technical reasons a natural tendency exists in many OECD economies for services to expand as these countries become richer.

This creates a double whammy: if productivity in services are low to start with, plus a natural expansion of services exists in many rich economies, then ultimately the sector becomes a real drag on overall economic growth the richer we get. That’s the long-held view.

However, this view becomes increasingly debunked. A new report that ECIPE has developed, which was commissioned by the Bertelsmann Foundation, now shows that not all services are unproductive. In fact, some services show healthy productivity growth patterns.

Therefore, good evidence is starting to come up proving the point that services do not need to weigh down on the economy. On the contrary, there is enough potential for services to perform better. The truth is that there is a lot of productivity in many services sectors that remains unrealized.

What can explain this? For one, our study shows that the low pick-up of digital technologies by services firms is an important factor to blame. For instance, using Eurostat data, the report shows that the share of business services firms in the UK and Poland that pick up digital technologies (as measured by our self-developed E-business indicator) is only half the rate of Denmark and Finland, as shown in the figure below.

Tuesday 17 September 2019

China’s Digital Trade Success: Two Different Perspectives

In recent times there has been a lot of talk on how big China’s digital trade actually is and to what extent it poses a threat to the global economy. China is big and appears successful in digital trade, and therefore the logic goes that China is leading the field. Others are more careful in cheering China’s digital success. The truth, however, is that there are two versions to the story. One is centred around the fact that China is indeed big. The other focuses on the extent to which China is actually competitive. The two stories are connected, yet extremely different. 

Both narratives are respectively illustrated in panels A and B below.

Panel A shows what I call the political story. This story reflects the fear of China becoming the biggest digital trader in the world. The panel shows digital services exports on the vertical axis (in USD log scale to compile the pattern) while showing the level of development (in USD PPP) on the horizontal axis for the year 2017. I take digital services and not digital goods for two reasons: One is that services reflect the future of digital trade; two is that the pattern for digital services and goods is the same, so analysing both would merely be repetitive. (There is one big difference between digital services and goods which I will address later).

First things first though, an upward sloping line appears on the vertical and horizontal axes in Panel A. It means that countries that progressively become richer also become more successful digital services exporters. How that works doesn’t matter for now. What matters is that the two indicators are tightly connected. Countries such as the US and the UK are much more developed and have greater levels of digital services exports; unlike Cambodia (KHM) or Mauritius (MRT).


Panel A: China is big and will continue to grow bigger in digital services trade…


Panel B: But China is uncompetitive and is likely to remain so in digital services trade.

Source: Author's; WB Development Indicators.

The remarkable thing about China, is that it has been a big digital trader throughout history, and is likely to remain so. That can be seen by the red dots which denote China from 1990 till 2017. At any year, China was a far bigger digital exporter than any country with a similar level of development. For instance, in 2000 China’s level of development was equal to Cambodia’s level of development today, i.e. in 2017. Yet China’s export in digital services were already bigger back then, than Cambodia’s is right now.

What’s more remarkable, however, is that China has caught up incredibly quickly with the world’s biggest digital traders. Panel A shows that since the 1990s China has steadily approached the EU, US and UK. All three are richer and have also historically shown a high level of digital services exports. But China, standing at a lower level of development, has managed to increase its export capacity in digital services, to a level in 2017 where it reached a par with the UK. The EU and US are still bigger digital traders, but it will only take about another 10 years before China reaches an equal footing with these two trade giants.

That has repercussions in the political sphere, particularly when negotiating trade deals. Bigger countries naturally have more weight in trade negotiations. However, they do not always naturally have a bigger trade basket, as they have bigger domestic markets which they can rely on. China’s case is different, as it has traditionally used trade as a successful strategy for economic development. Today the EU is still the biggest exporter of digital services, ahead of the US and China. It therefore currently has the biggest heft when negotiating digital services trade issues; far bigger for instance than the UK will ever have.

In short, the political economy discourse about the “fear” of China’s digital trade success, which one can read daily in the popular media, stems in great part from the sheer size of the country. Don’t get me wrong, size does matter, and it certainly makes a difference on how successfully countries like Guatemala or China can negotiate in trade negotiations. For instance, China has been a big trader in the past of ICT or high-technology goods. Indeed, at all levels, it has been a bigger trader in digital goods than all other countries, including the EU and US (Panel C). As such, China has influence on international digital trade negotiations.

However, there is another perspective on the matter, which I call the economic story. That story is reflected in Panel B. Economists have always been sceptical of the idea of using plain magnitudes expressed in nominal or absolute numbers. Rather, economists tend to transmit their messages in “normalized” numbers, so that any form of size, quantity or volumes are instead computed as ratios, weights or proportions. The big reason for doing so is that otherwise numbers may be biased in favour of other characteristics, such as in our case the huge size of a country. After all, China may be big, but that may not tell us anything about its true economic success.

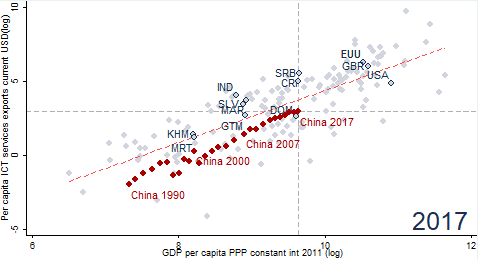
Panel B investigates how competitive China is once we disregard its sheer size. Note that I again analyse digital services trade, as my view is that this is where the future of trade is heading. Interestingly, using similar metrics as in Panel A, the story gets reversed. To correct for China’s size when using its nominal numbers of digital service exports, I divide this variable by its population.

Through that way I obtain a more neutral representation of the true extent of China’s export success, which economists typically call the per capita exports. It’s a much fairer way of comparing China with other countries, as smaller countries trade a much smaller amount. Once we divide the absolute size of digital services exports by the number of people in each country who potentially trade, an undistorted picture of the true strengths of digital trade exports is presented. In other words, it shows the real digital export competitiveness.

Looking at Panel B, it becomes clear that China’s real digital trade competitiveness is actually much lower compared to using non-normalized trade figures. In fact, the red dots that denote China’s development over time, are all placed below the dashed fitted values line, which represents the “average” trend between how rich countries are at a certain level and their per capita digital services exports. Compared to other countries, China is less competitive in digital services exports than can reasonably be expected based on its level of wealth.

That was true in the past and is true in the present. For instance, back in 2000, when China shared a similar level of development as Cambodia today, the latter exported more digital services when the size of the market was accounted for. Similarly, in 2017, Guatemala was able to export more digital services on a per capita basis than China did in 2007; when the two countries shared a similar level of economic development. Today, China is as rich as Serbia or Costa Rica, but the two latter countries are far more competitive regarding digital services trade, given their rate of economic development.

What’s more, there are little signs that China’s competitiveness position is approaching any average midpoint value (dashed line), based on what could be expected when taking into account the level of development of all other countries in the sample. Nor does China approach the competitiveness position of the EU, the UK or the US. (Note that the US suffers from a relatively low level digital services export competitiveness, meaning that for whatever reason the country is performing below its potential given its already massive success.) In fact, the EU is in a pretty good shape as it is placed above the fitted values line – although several other countries are doing much better still.

So, what should the conclusion be when putting these two panels together? Well first, one big message from this exercise is to show that one shouldn’t conflate size with “real” size. Yes, China may be big, and the economic size of China may disturb us from time to time, but it’s another thing to claim that because of its size the country is going to be a giant success in all manners of our digital life, and take over the digital world economy. Sure, China has success in some parts, and perhaps many parts of the digital economy, but not in all parts. In goods, the country is a major success, and so too it seems in digital goods (compare panels C and D in the annex). However, for digital services the story is a different one.

Second, the fact that China is precisely less competitive in services has implications for future trade. The world economy is increasingly shifting into an invisible one in which services, data, technology ideas and know-how are replacing goods, commodities and other physical inputs. In this intangible world, China appears to be far less successful compared to other big trade giants. Moreover, China is also very restrictive when it comes to digital trade, data and internet technologies. Different digital standards and restrictive digital policies, such as China has today, are harmful for its digital services trade and eventually real export competitiveness (Ferracane and van der Marel, 2018).

Therefore, it remains to be seen whether China’s isolated stand regarding data and the internet will prove to be beneficial for improving its export competitiveness the long run. 


Panel C: China is big and will continue to grow to be the biggest in digital goods trade…


Panel D: And China is competitive and is likely to remain so in digital goods trade.

Source: Author's; WB Development Indicators. 

Wednesday 5 June 2019

Solving EU’s Amazon Paradox

Here's a question for you. 

I recently attended a seminar about Europe’s digital future where I was asked: “How come we have the Amazon Paradox in Europe?”. To explain, the Amazon Paradox involves the package delivery time between EU member states that is excessively long compared to the US. In short, if I want to send a package from Brussels to say Sofia, it travels for up to 8 days, whereas in case I would send it to the US, it only takes 2 days.

How is this possible? That was the question. To give context, the seminar itself was about Europe 4.0. It discussed the way in which Europe can be made more competitive through the use of new digital technologies. The automatic response to the question was that many European countries still uphold digital trade restrictions. Given that Amazon is an online platform, it must be that digital trade restrictions such as strict intermediate liability regimes or data policies are the culprit. Right?

After all, our own research showed that several restrictions regarding e-commerce platforms are still relatively high for some EU member states. Of the 64 countries analysed worldwide, European countries such as France, Germany and Italy show a level of restrictiveness that is placed above average. So, the problem of delayed package delivery in Europe must surely have something to do with these restrictions.

As a matter of fact, I don’t think so. Yes, Amazon is a digital platform and it may encounter some digital barriers, perhaps even in some digital services such as digital finance, but my assessment is that the bulk of the package delivery problem lies somewhere else, namely in Europe’s network services.

Accessing Amazon’s website and order something does not seem to me any problem. What’s more problematic are all the services that lie behind the internet transaction. The package needs to travel from one destination to another. It is most likely to use postal delivery services or any other transport and storage services. That’s exactly where the bottle neck seems to appear. In many European countries, these network markets are still largely uncompetitive.

A simple snapshot of some OECD numbers is telling. The picture below gives a screenshot of the OECD’s Product Market Database that records the level of non-digital regulatory restrictiveness in network services. The message from these numbers is quite interesting. For instance, although the market for postal service is entirely free for new firms to enter, which gives the impression that competition is optimal, the yellow column indicates that public ownership restrictions are still rampant.


Restrictions on public ownership includes the extent to which State-Owned Enterprises (SOEs) are still present in the postal market, how much governments are generally involved with the operations of the postal incumbent firm, or whether they have a direct control over the postal services company. Restrictions in this field also relate to how these SOEs are governed. For instance, whether the state or provincial governments have special voting rights (e.g. golden shares) in at least one firm.

The scoring of this restrictiveness index ranges between 0-6, with increasing levels indicating higher levels of regulatory barriers. Looking at the yellow column, it becomes clear that many European countries have a level of restrictive regulations in the postal market that stands at 5. True, numbers are from 2013 (latest year available), but nothing suggest that all these countries have quickly reformed their markets over the last couple of years. Similar conclusions are true for rail transport services.

The European Commission is also very aware of the issue. As stated in a recent report that was commissioned by its in-house staff: “One of the core objectives of the EU’s Digital Agenda is to promote cross-border e-commerce…” The report continues: “The Commission identified expensive and unreliable cross-border delivery as one key challenge in the future development of e-commerce”. Auch!

Another report commissioned by the European Commission states the problem in clear numbers. It looked at the price differences between what it would cost to send a package within and across EU members states. And guess what, this differential price in package delivery is equal to a factor of 3.71. This comes down to an average price difference of 471 percent for packages sent to another country in the EU compared to sending domestically. 

In short, these numbers point out that the international postal market delivery services are still largely uncompetitive. I think that this is the main driving force behind Europe’s Amazon Paradox. With price differences so high, it reflects that the market suffers from a lack of competitive forces from which indeed e-commerce companies like Amazon encounter a paradox: although the distance to the US is larger, package delivery is faster. 

Friday 18 January 2019

Online Platform Restrictions and Small Firm Exports

Stricter rules on online platforms restrain potential trade, especially for smaller businesses. This is because online platforms facilitate export and import by lowering transaction and information costs. Ultimately, restrictions on online platforms limit the capacity of the ICT sector more generally to contribute to the overall economy.

A recent study by McDaniel and Parks (2019) shows that, among those businesses that export, the share of firms using Facebook can be high for some countries. For instance, in Czech Republic, Portugal, Turkey, and South Korea more than 15 percent of businesses that export are also on Facebook. This share is even higher for small and medium sized firms (SMEs). Therefore, it seems that the use of online platforms such as Facebook creates a stronger propensity to export compared to other firms.

Once a firm finds itself on a digital platform such as Facebook, its presence can help to create visibility and to capitalize on the platform’s online network, eventually reducing information and search costs for companies and consumers. According to the study, some developing countries profit the most from being present on Facebook. In Bangladesh and Pakistan, for instance, 20 and 18 percent of businesses that export are also present on this social app.

However, to make use of online platforms is not always an easy task. Certain policies inhibit companies from accessing online platforms, especially foreign ones. These policies often create unnecessary costs for businesses, particularly for smaller firms as they make it difficult to intensify exporting abroad. Moreover, and perhaps even more importantly, the presence of online platforms themselves is not a given in some countries reducing the ability of small firms to promote their businesses online in the first place.

This phenomenon is a problem if we consider an increasingly strict regulatory environment for online platforms. In a recent study by me and my co-author Martina Ferracane, we show that this is actually true for quite a number of countries.

The study maps the regulatory environment for online platforms in terms of trade restrictiveness for 64 countries. More precisely, we measure the online platform trade restrictiveness using the information available in the Digital Trade Estimates database, from which we have already developed the Digital Trade Restrictiveness Index (DTRI). By selecting only those policy measures that affect online platforms and by finetuning the methodology, we have created the Digital Platform Restrictiveness Index (DPRI).

Thursday 13 December 2018

Productive services with the help of internet technologies.

See here my new piece for the Asian Development Bank Institute's blog: Productive services with the help of internet technologies: https://bit.ly/2rzBOZB

It's about how new digital technologies can "cure" the long-standing concern of services suffering from low productivity growth. That's not longer a necessary development.

Yet, to let new digital technologies do what's best to make services more productive, policies need to be set right. Read the blog for why and how that can be done. 


Monday 12 November 2018

Global Value Chains and Digital Trade Restrictions Part II

Last month, I wrote about how digital trade restrictiveness of countries is associated with how much countries participate in Global Value Chains (GVCs). This follow-up column explains how digital trade restrictions are also strongly associated with where countries participate in GVCs.

In another blog post, I made clear that the use of ICT in GVCs is unrelated with the complexity of value chains. Instead, ICT-intensity of GVCs relates better with the relative position of industries in value chains. That is, where industries are most active in GVCs. In fact, industries closer to consumers are often industries that are also relatively more ICT-intense. They are placed more downstream. Vice versa, industries that are more upstream often appear less ICT-intense.  

Now, this pattern is also reflected with regards to countries’ digital trade policy framework: countries that are less restricted across the whole range of digital trade policies are more active in supply chains that are closer to the final consumer, i.e. more downstream. On the other hand, countries that are more restricted with digital trade policies are often trading more in upstream value chains, being further away from final consumers.

This can be seen in the figure below. The vertical axis plots a measure of the relative position of countries in their supply chains. Higher values on this indicator means higher GVC “upstreamness” of countries, trading more in GVS that are more upstream. The horizontal axis plots ECIPE’s Digital Trade Restrictiveness Index (DTRI) with higher values reflecting greater digital trade restrictiveness. 

The graph shows that countries such as Indonesia, India, Brazil and Turkey are more restricted regarding digital trade policies whilst also trading more upstream in GVCs. Contrary, countries which are less restricted in digital trade policies are trading more downstream in their supply chains. They are closer to the final destination of the good (or service), i.e. the consumer.


Source: ECIPE; COMPNET

Thursday 18 October 2018

Global Value Chains and Digital Trade Restrictions Part I


Today, I gave a talk at Bruegel’s Asia Europe Economic Forum (AEEF) on Global Value Chains (GVCs) and restrictions on the use of digital technologies across borders. It was part of a panel session that was dedicated to GVCs and the 4th Industrial Revolution. It was a great opportunity to connect our Digital Trade Restrictiveness Index (DTRI) with that of GVCs.

The underlying question of my presentation was: How much of an important factor are digital trade restrictions for GVCs? As it turns out, a lot!

When talking about the 4th industrial revolution, we often talk about many different concepts such as Artificial Intelligence (AI), Internet of Things (IoT), big data and cloud computing. One commonality these technologies have is the use of data over the internet. The figure below shows which sectors in the economy use a lot of data, and are therefore intense in the use of digital technologies.

Interestingly, besides many services that are data-intense, some advanced GVCs are in fact also very data-intense (something I referred to in February this year in another blog post). Computer electronics, Machinery, Chemicals and Motor vehicles are sectors that thrive on GVC networks and the figure shows that these sectors are also very data-intense by using lot of digital technologies. 


Now, how do digital trade restrictions come into the story? The answer is simple: as these GVC sectors use a lot of digital technologies, digital trade must surely be a factor of importance of how competitive such sectors can be. After all, open markets provide firms with the best available technologies through competitive goods and services, and thus also competitive digital goods and services.

That’s indeed the case. That becomes visible in the following figure. In there, the DTRI is plotted on the horizontal axis, measuring the restrictiveness in digital trade for a host of countries; whilst the vertical axis plots a measure of GVC participation, which is nothing else than an advanced indicator that measures the extent to which countries show more or less trade in GVCS.

As we slide along the horizontal axis from left to right, we see that countries which are more restricted are also showing a lower participation in GVC sectors. Conversely, if we move along the horizontal axis from right to left, we see that countries with lower levels of digital trade restrictions precisely have a higher level of GVC participation. Therefore, digital trade restrictions really seem to matter for participating and being competitive in GVCs. 


There was more in my presentation that warrants another blog post. But one thing I would like to tell is that besides how much a country participates in GVCs, digital trade restrictions also appear to matter a lot for where countries are active in GVCs. So not only do digital trade restrictions matter how much a country capitalizes on GVCs, but also where in the supply chain they are active.

As it turns out, they are precisely active where services come in. But that’s for a second blog post later on.